Primary Care Spending: A sample of current research and state policies
by Gina Carr, MD
Despite the knowledge that societies with a better primary care orientation have better outcomes as well as increased efficiency and better perceptions of patient experience of care, we are not yet routinely incentivizing primary care providers (PCPs) and services. Why is the societal value of reduced mortality rates, reduced rates of low birth weight and preventable hospitalizations, and increased self-rated health status efficiency so UNDER-valued in our society? We risk losing our pipeline of PCPs due to discrepancies in reimbursement between specialist and primary care services and there is very little public policy to help protect this important asset in our society.
The Milbank Memorial Fund’s report “Standardizing the Measurement of Commercial Health Plan Primary Care Spending” tried to assess whether it is feasible to perform the measurement of primary care spending comparably across insurers and to determine whether the work could be performed with voluntary insurer participation. With the assistance of a panel of industry experts, primary care was defined in two ways for the purpose of the study: (1) all medical services delivered by primary care providers (including non-evaluation and management [E&M] services, such as office-based procedures), (2) all office visits and preventive services delivered by primary care providers. They also studied the effect that the following four subsets of definitions had on the data:
- PCP-A: family medicine, general internal medicine, general pediatrics, or general practice and designated by health insurer as a PCP
- PCP-B: PCP-A + NP or physician assistant (PA)
- PCP-C: PCP-B + geriatrics, adolescent medicine, or gynecology
- PCP-D: designated by health insurer as a PCP (no specialty requirement)
The data collected was divided into fee-for-service (FFS) and non-fee-for-service (non-FFS) and most INCLUDED dollars spent on prescription medications. FFS payments only included money spent by the payer, no co-pays, co-insurance, or deductible paid by the patient was included. Non-FFS included payments made to Primary Care Medical Homes (PCMH) in the form of per-member, per-month (PMPM) payments, capitated payments, and shared savings or pay for performance initiatives that practices may be involved in.
This report showed that it is POSSIBLE to measure the total money paid for primary care services versus total medical expenses. The major take-aways from this study are as follows:
- average primary care spending is 7.1 – 8.6% of total medical spending
- most primary care spending continues to be in the form of FFS payments (only 0.6-1.0% of overall spending in non-FFS payments)
- differences in the definition of PCP (subsets A > D, above) mattered LESS (+/- 1.3%) than the breadth of services included in the definition (ALL services by PCP v office visits/preventive care services only) provided by designated PCP (+/- 2.5-2.8%).
This report also reflected that voluntary reporting was a challenge, which all-payer-claims databases or state statute can potentially help with. Further, the non-FFS data was more challenging to collect so new payment models and primary care delivery systems will continue to present new data collection challenges.
STATE INITIATIVES
Two states have thus far adopted legislation focused on measuring primary care spending, Oregon and Rhode Island. Oregon’s efforts have been limited to data collection. Similar to the previous report, primary care spending is divided into claims-based spending (primary care services provided) and non-claims-based spending (efficient care delivery, quality or cost-saving share payments, building primary care infrastructure or capacity investments such as PCMH payments health information technology investments, and money for supplemental staff such as practice coaches, patient educators, navigators, nurse care managers). Claims-based figures were collected largely from the state’s All Payer All Claims (APAC) database and non-claims based figures were collected from specialized reporting templates completed by carriers. Unlike the Milbank report, these figures EXCLUDED prescription medication cost.
Prominent insurance carriers averaged 9% of total spending on primary care (range 3-16%), whereas Medicaid Coordinated Care Organizations (CCOs) averaged 13% of total spending on primary care (range 7-31%). The portion of non-claims based payments were much greater for CCOs than for other payers – on average 61% of primary care spending by CCOs was for non-claims-based payments and for other payers this was as low as 3%.
Rhode Island has not only taken on measuring, but has required a 1% increase per year from 2010-2014, without increasing premiums or overall medical costs. This model “encourages efficient, affordable health care through organizational innovations in care delivery and payment reform” as evidenced by the fact that during this time frame not only were insurers able to meet these increased targets, but TOTAL medical spending went down!
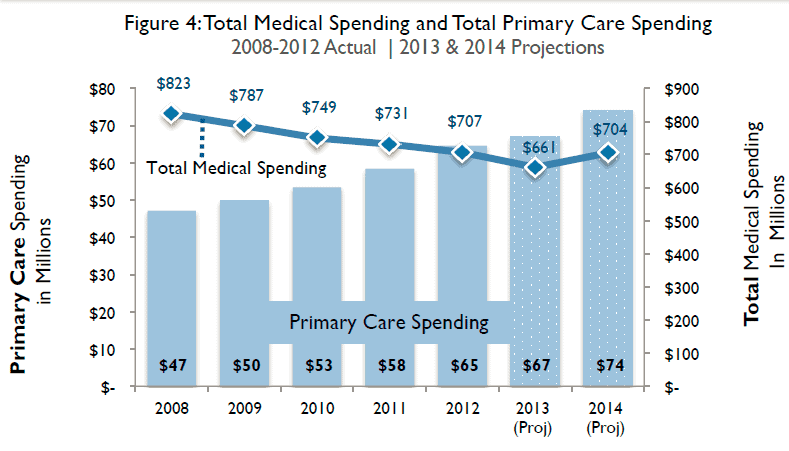
Other encouraging trends noted in the RI data is that non-FFS payments to PCPs are going up (< 10% in 2008 to > 40% in 2014!) and primary care seemed to be bolstered overall by this initiative through investments in medical homes, incentive payments to providers, and health insurance exchange and health information technology investments.
Therefore, precedent has been set that could allow Colorado to be the next state to pass legislation geared toward increasing the primary care spending targets. If we are able to do this, not only will it help incentivize PCPs and help keep our pipeline of this important part of the healthcare system in place for years to come, but we can as a society provide patients with better perceived care AND better outcomes!
Share this post...